
Solar Plan Set Turnaround Time: Real 2026 Benchmarks

Solar Plan Set Turnaround Time: Real 2026 Benchmarks
Ask five design partners about their solar plan set turnaround time and you’ll get five different answers. Twenty-four hours. Forty-eight. Two to five business days. However, none of them measure the same thing.
The quoted number tells you when a PDF lands in your inbox. Meanwhile, it says nothing about whether that PDF clears plan check on the first pass — and that’s the only part your install calendar ever feels.
Key takeaways
- Standard outsourced residential turnaround runs 2–5 business days; the fast tier hits 24–48 hours.
- Effective turnaround = quoted turnaround + (rejection rate × correction cycle length).
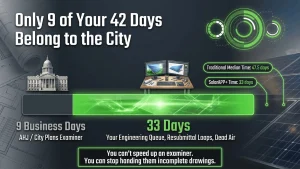
- Only about 9 business days of a 42-day permit cycle sit with the AHJ.
- One correction cycle costs $2,000–$5,000 and restarts the review clock.
- Post-July 2026 project starts must reach service by December 31, 2027.
What Is a Normal Solar Plan Set Turnaround Time in 2026?
Standard outsourced residential design runs 2 to 5 business days. Anything past 7 business days starts breaking install schedules. Meanwhile, the fast tier delivers in 24 to 48 hours, and best-in-class providers hit 15 to 24 hours on residential work.
| Tier | Residential | Commercial |
|---|---|---|
| In-house CAD (manual) | ~3 days + revisions | 4–7 days |
| Standard outsourced | 2–5 business days | 3–7 business days |
| Fast tier | 24–48 hours | 48 hours |
| Best-in-class | 15–24 hours | 24–48 hours |
The Rejection Math Behind Every Turnaround Quote
A quoted SLA covers half the equation. The other half is what happens when the AHJ kicks it back.
Effective turnaround = quoted turnaround + (rejection rate × correction cycle length)
Run two vendors through it. Vendor A quotes 24 hours but clears plan check first time on 75% of jobs. Vendor B quotes 36 hours and clears 99%.
Because only about nine business days of a roughly 42-day cycle covers actual plan review, one rejection costs you those nine days again — plus your own resubmittal prep. Therefore Vendor A’s real average lands near four days per job. Vendor B stays under two.
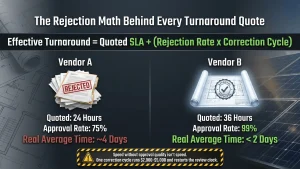
Then add the invoice. A single correction cycle runs $2,000 to $5,000. At a 25% rejection rate, you’re baking several hundred dollars of expected rework into every project.
In short: speed without approval quality isn’t speed. It’s a faster route to the back of the same line.
Worth knowing where rejections come from, too. NEC 690.8 issues drive 30–40% of U.S. permit rejections — a code-currency problem, not a drafting-speed problem. With NEC 2020, 2023, and 2026 all enforced somewhere right now, a vendor who hits 24 hours against the wrong edition costs you two weeks. Our permit plan set checklist covers what belongs on every sheet.
Only Nine of Your 42 Days Belong to the City
NREL data puts median time from permit submission to final passed inspection at 47.5 days traditional versus 33 days with SolarAPP+. Ask ten installers why their cycle runs six weeks, and nine blame the AHJ.
The numbers disagree. Nine business days sit with the plans examiner. Consequently, the other thirty-plus live in your engineering queue, your resubmittal loop, and the dead air between handoffs. Those days belong to you. We broke that split down in Permit to Install Time: Cut 42 Days to 24.
Instant Permitting Makes Solar Plan Set Turnaround Time Matter More
This one runs counterintuitive, so follow it through. SolarAPP+ now covers 240-plus communities, and Houston’s building official reported dropping from nine days to one after adoption.
When the city approves in minutes, the AHJ variable drops out of your equation. So what’s left? How fast your plan set arrives, and whether it was right. In instant-permit markets, your design partner is the bottleneck.
Two catches, though. Florida still has zero adopting jurisdictions. In addition, eight eligibility rules push projects back into full review — ground mounts, 400A-plus service, and 140 mph wind zones among them. See which states run instant permitting before you promise a date.
Seven Questions to Ask a Fast Solar Design Service
- When does the clock start? Upload, complete intake, or next business hour?
- Does it pause when you ask me a question?
- Are revisions inside the SLA? Per-revision pricing turns a $1,200 set into $1,800 — and quietly rewards sloppy first passes.
- What’s your first-submission approval rate, across how many projects?
- Which NEC edition do you draft to, and how do you confirm what my AHJ enforces?
- Do you hold PE licensure in my expansion states? Hunting a local stamp never appears in a quoted SLA.
- Does that SLA hold at peak volume, or only at average?
Why 2026 Turned Speed Into a Deadline Problem
Speed used to be a cash-flow annoyance. This year it’s an eligibility question.
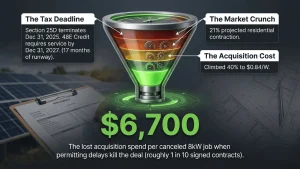
Section 25D terminated on December 31, 2025, with no step-down. Furthermore, solar facilities that began construction after July 4, 2026 must reach service by December 31, 2027 to claim the 48E credit. That leaves roughly seventeen months of runway — while the average project takes about 16 weeks from signature to operation.
Market pressure sharpens it. SEIA and Wood Mackenzie project a 21% residential contraction for 2026. Customer acquisition cost climbed about 40% to $0.84 per watt. Meanwhile, roughly 1 in 10 signed contracts cancel before install, with permitting delays among the top causes — about $6,700 in lost acquisition spend on an 8 kW job.
Fewer jobs. Pricier leads. A hard placed-in-service date. As a result, every day parked in an engineering queue costs more than it did last year. Jurisdiction spreads make it worse; our state-by-state permitting timelines show the range.
Track Your Own Baseline First
Most installers can’t calculate their solar plan set turnaround time because the timestamps live in email threads and one person’s spreadsheet.
Start logging six stamps per project: contract signed, intake sent, plan set received, permit submitted, permit issued, install scheduled. Two weeks of that shows exactly which handoff bleeds days — and whether your vendor or your intake packet caused it. Incomplete site data remains the most common reason a 24-hour clock never starts. A template-per-AHJ system fixes the intake side.
Fix the 33 Days You Actually Control
You can’t speed up a plans examiner. You can absolutely stop handing them incomplete drawings.
Energyscape Renewables delivers PE-stamped, NEC-compliant plan sets in 15–24 hours residential and 24–48 hours commercial across all 50 states, with a 99% first-submission approval rate and revision cycles handled in-house. One partner covers plan sets, stamping, permit submission, AHJ follow-up, interconnection, and PTO. Request a plan set →
Sunscape proves the numbers. This solar CRM timestamps every stage from contract to PTO, so “our permits feel slow” becomes “we lose 6.2 days in intake prep.” Its site survey app captures clean field data on the first visit — which is what makes any 24-hour SLA actually start on time. Book a demo →
Fast engineering. Measurable pipeline. Take both.
Frequently Asked Questions: solar plan set turnaround time
How long should a residential plan set take in 2026?
Two to five business days counts as standard, while 24 hours is achievable with a specialized partner. Past seven business days, you absorb a scheduling penalty.
Is a faster solar plan set turnaround time always better?
No. A 24-hour vendor at a 75% approval rate delivers slower real permits than a 36-hour vendor at 99%, because each rejection restarts a nine-business-day review.
Does outsourcing beat in-house design?
In-house math generally wins above roughly 500 plan sets a year in one state where your engineer holds the PE, where loaded cost drops below about $400 per set. Below that, outsourcing wins on speed and coverage.
sjayakanth@energyscaperenewables.com