
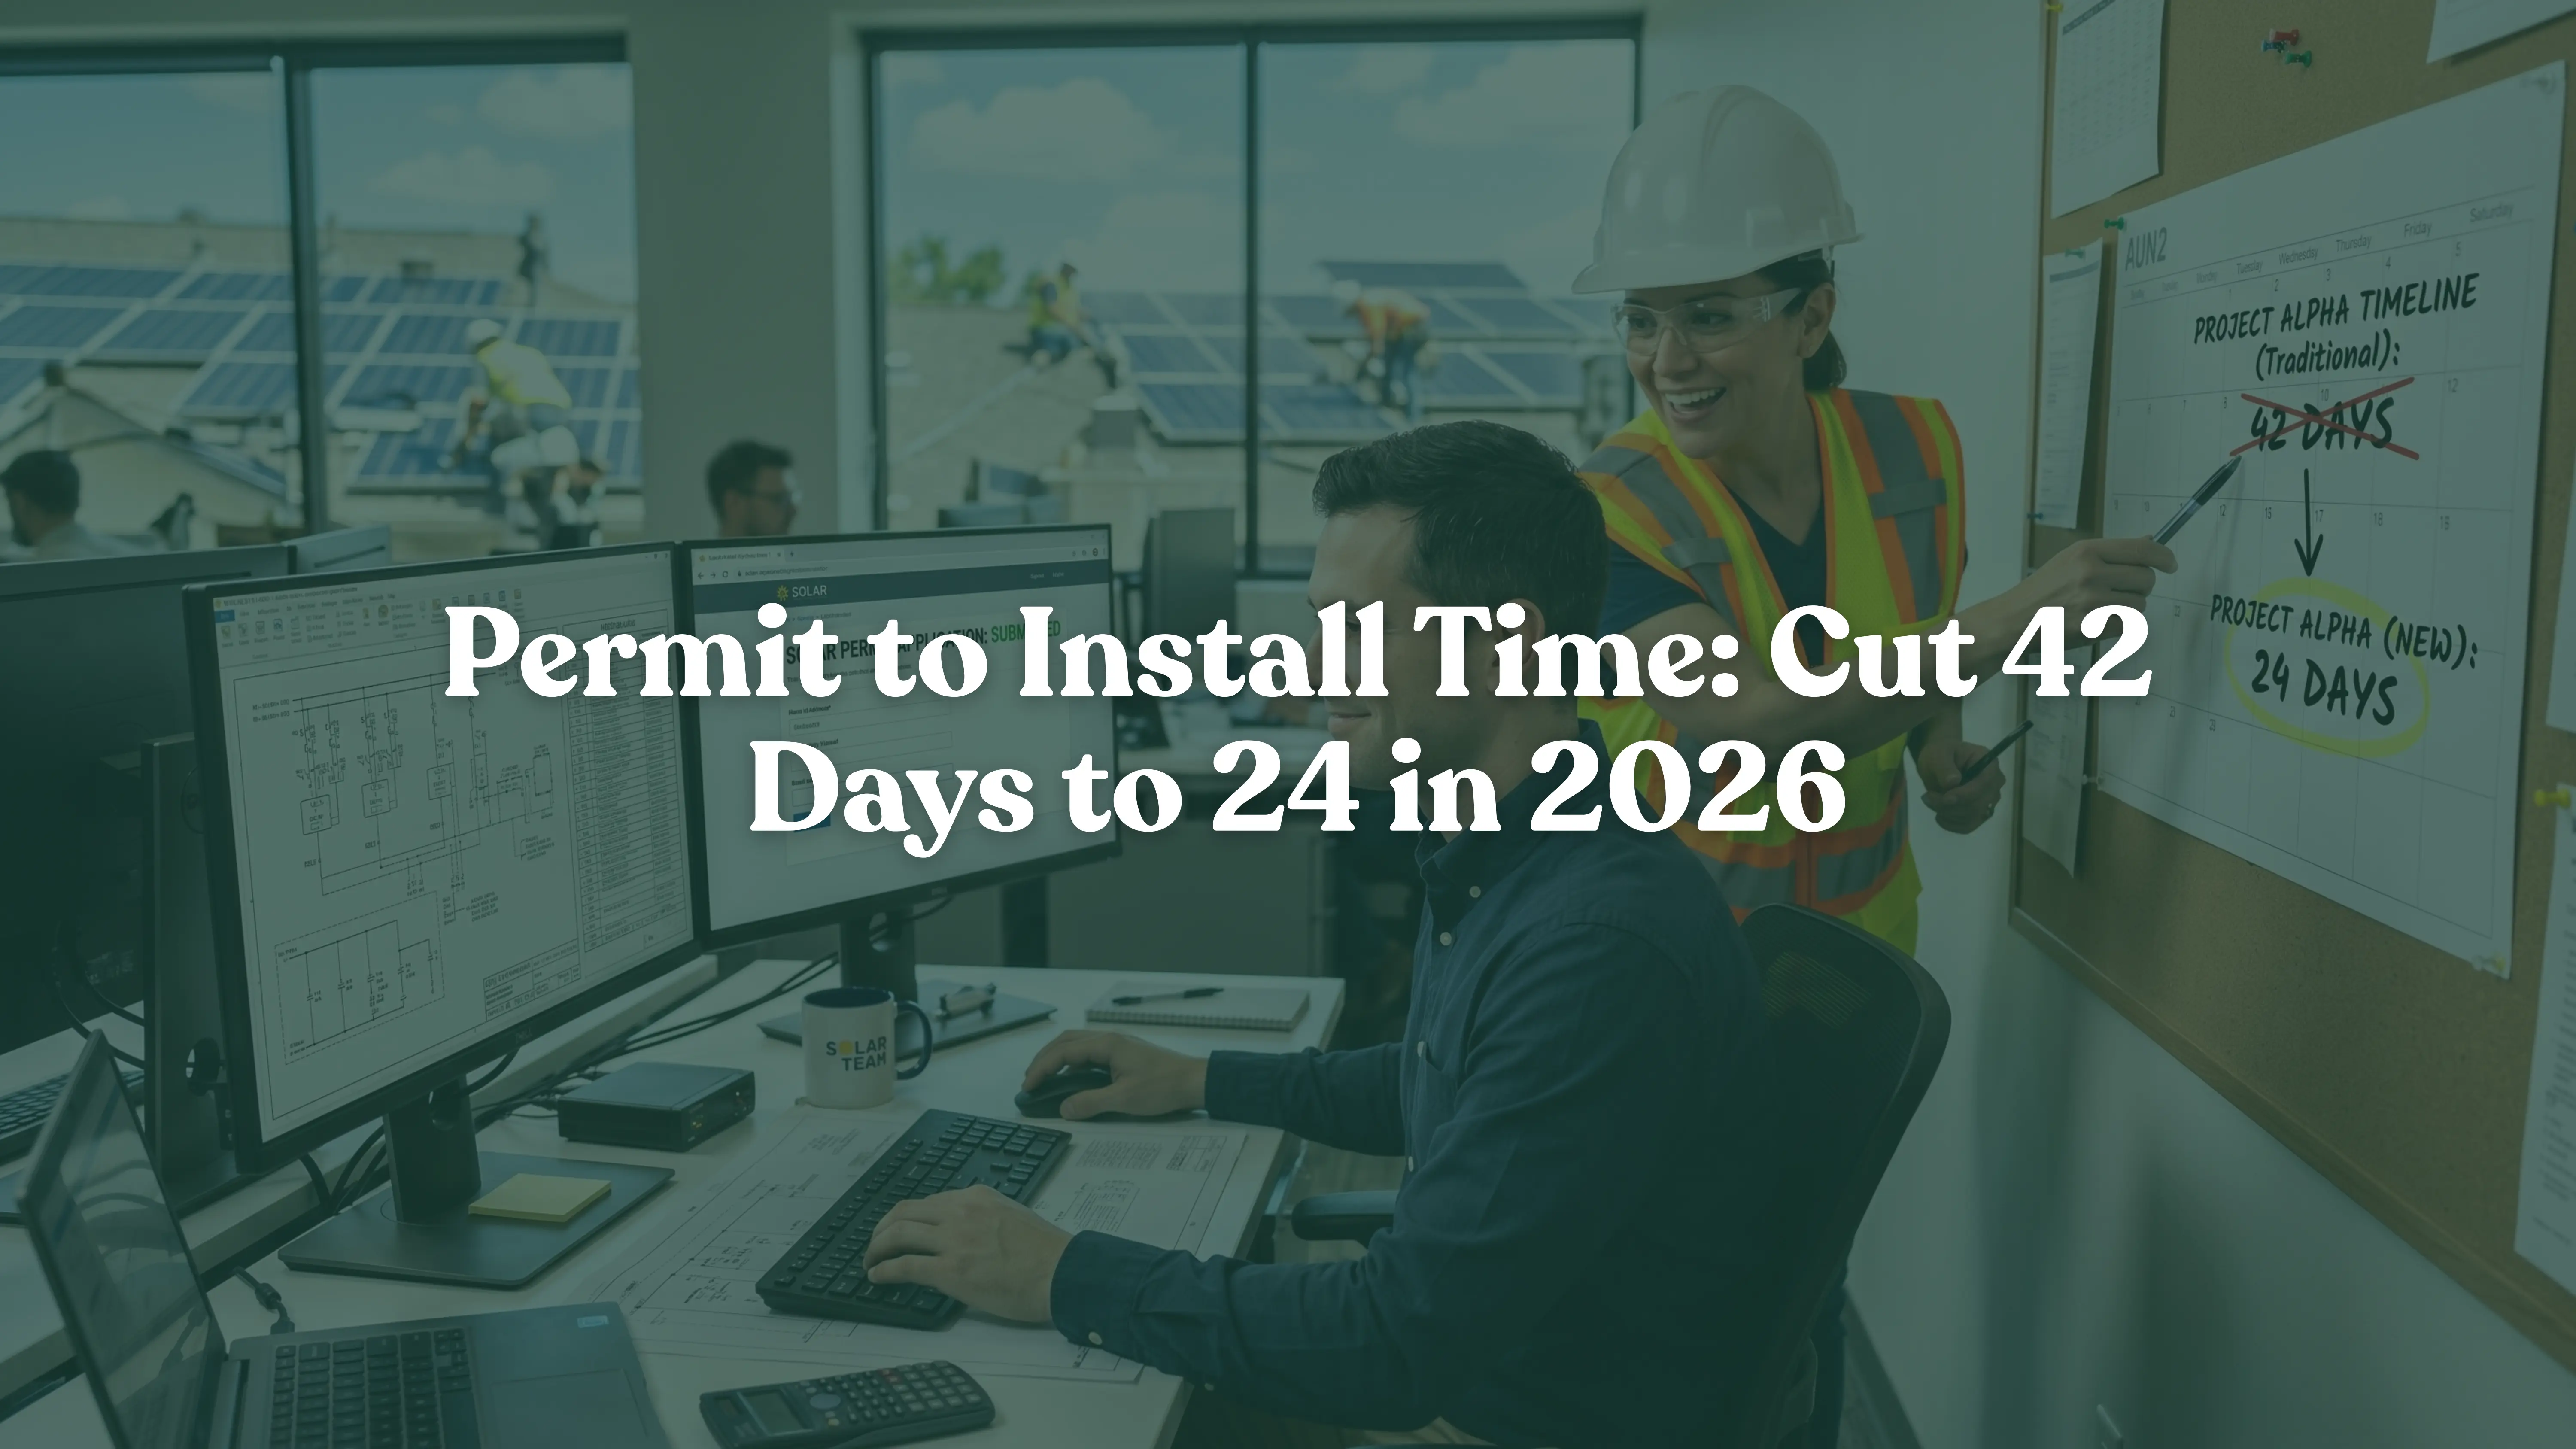
Permit to Install Time: Cut 42 Days to 24 in 2026
Permit to Install Time: Cut 42 Days to 24 in 2026
Permit To Install Time Key takeaways:
- Median permit-to-inspection time: 47.5 days traditional vs 33 days with SolarAPP+ (NREL).
- Only about 9 business days are actual AHJ plan review. The rest sits with your team.
- One rejection restarts the clock and costs $2,000–$5,000 per correction cycle.
- NEC 690.8 issues drive 30–40% of US permit rejections.
- Residential capacity is forecast to fall 21% in 2026, so every backlogged job matters more.
Ask ten installers why their permit to install time runs six weeks, and nine will blame the city. The numbers tell a different story. NREL found the median gap between permit application and permit issuance under traditional review is roughly nine business days. Nine, out of about forty-two. So where do the other thirty-three go? They disappear into your engineering queue, your resubmittal loop, and the dead air between handoffs. That’s the uncomfortable part — and also the good news.
What is permit to install time?
Permit to install time is the number of calendar days between submitting a solar permit application to the AHJ and the crew starting installation on site. Some teams measure through final passed inspection instead. Either way, it’s a cycle-time metric, not a compliance metric.
According to NREL’s SolarAPP+ performance review, the median duration from permit submission to final passed inspection was 47.5 days for traditional permits and 33 days for SolarAPP+ permits. That’s a 31% reduction on the same code, the same gear, and the same roof.
The 42-day stack: where permit to install time actually goes
| Stage | Typical | Compressed | Owner |
|---|---|---|---|
| Design → PE-stamped plan set | 5–7 days | 1 day | You |
| AHJ plan review | ~9 business days | 0–9 days | AHJ |
| Rejection + resubmittal loop | +14 days on 1 in 5 jobs | Near zero | You |
| Handoff gaps between stages | 5–8 days | 2–3 days | You |
| Scheduling + inspection | 8–12 days | 6–8 days | Shared |
Three of these five blocks sit entirely inside your four walls. That’s where the eighteen days live.

Engineering turnaround
If plan sets take a week, you’ve burned 17% of the cycle before the city opens the file. Teams running 24-hour stamped turnaround start the AHJ clock six days sooner on every job. For turnaround benchmarks, see our PE stamp guide.
AHJ plan review
You can’t speed up a plans examiner. However, you can pick the fast lane where one exists. SolarAPP+ issues instant permits for compliant residential systems, and adoption reached 275 jurisdictions across 13 states by late 2025. Check availability before assuming a two-week wait.
The resubmittal loop
A rejection isn’t a delay. It’s a restart. NEC 690.8 problems trigger 30–40% of US permit rejections, and each correction cycle runs $2,000 to $5,000 before crew rescheduling. At an 80% first-pass rate across 50 jobs, that’s ten resubmittals, roughly $40,000, and 140 lost days. Our first-pass approval playbook covers the fixes, and the AHJ redline guide handles the aftermath.
Handoff gaps
Nobody measures this block, which is exactly why it’s fat. The plan set lands Tuesday and gets filed Friday. Approval hits Monday and reaches scheduling Thursday. Nobody dropped the ball — the ball just sat there. Consequently, you cannot compress what you don’t timestamp.
Inspection
A failed final sends you back to the same queue. Notably, DOE reports SolarAPP+ projects fail inspection about 29% less often, mostly because inspectors get a standardized checklist. Build your own version from the approved set.
Why permit to install time matters more in 2026
Four things shifted at once.
First, the market is shrinking. SEIA and Wood Mackenzie project a 21% residential contraction for 2026 after Section 25D expired on December 31, 2025. Fewer jobs means each one has to convert.
Second, leads got expensive. Customer acquisition cost is climbing toward $0.84 per watt. Meanwhile, NREL survey work shows roughly 1 in 10 signed contracts get cancelled before install, with permitting delays ranked among the top causes. On an 8 kW job, that’s about $6,700 in acquisition spend you never recover.

Third, third-party ownership changed the cash math. TPO share is moving from around 45% of installs toward 60–69%, and the 48E begin-construction date lands July 4, 2026. Because TPO sponsors fund on milestones rather than signatures, slow cycle time now starves working capital.
Fourth, code fragmentation is raising rejection odds. NEC 2026 is rolling out unevenly while many jurisdictions still enforce 2020 or 2023. Therefore, a template that cleared last quarter can fail this one. Our AHJ plan set requirements post maps what changed.
Five moves that cut permit to install time to 24 days
- Timestamp every stage. Log submittal, approval, and dispatch dates separately. Your real bottleneck will surprise you.
- Get engineering to 24 hours. Six days back immediately, on every project.
- Buy first-pass approval, not cheap plan sets. A $150 saving that triggers a $3,000 correction is not a saving.
- Route SolarAPP+ jurisdictions separately. Different lane, different crew planning.
- Assign owners to handoffs. Give each transition an SLA, not just each task.
Do all five and 42 becomes 24. Do the first three and you’re already near 30.

Start with the two blocks you control
Fix the engineering block first. Energyscape Renewables delivers NEC 2026-compliant, PE-stamped plan sets in 15–24 hours for residential work, licensed across all 50 states, at a 99% first-submission approval rate. That takes six days off the front of every job and closes the resubmittal loop at the back. Request your plan set →
Then expose the hidden days. Sunscape tracks each project from site survey through permit submittal, approval, install, inspection, and PTO in one pipeline — with stage-level timestamps. You’ll finally see whether your 42 days belong to the AHJ or to a Thursday nobody owned. Book a demo →
Energyscape removes days from your clock. Sunscape shows you which ones you’re losing.
Frequently asked questions
How long does it take from solar permit to install?
Nationally, expect 40 to 47 days from submittal through passed inspection. Well-run teams reach 24 to 30 days.
Why is my solar permit taking so long?
Usually it isn’t the city. Slow engineering, one rejection cycle, and untracked handoff gaps account for most of the delay.
Does SolarAPP+ actually save time?
Yes. NREL measured 33 days versus 47.5 days, plus a 29% lower inspection failure rate.
What is the average solar permit review time in 2026?
Roughly nine business days under traditional review, and same-day in SolarAPP+ jurisdictions.
sjayakanth@energyscaperenewables.com