
Solar Soft Costs in 2026: Where Your Margin Actually Leaks
Reducing Solar Soft Costs in 2026: Where the Money Actually Leaks
For twenty years, the federal tax credit quietly covered your inefficiency. A rejected plan set. Then a three-week AHJ delay. And then redesign after the site survey. The homeowner still got a deal, so the deal still closed. That cushion is gone — and solar soft costs are now the clearest threat to your margin.
The One Big Beautiful Bill Act, signed July 4, 2025, ended the Section 25D residential credit for any system placed in service on or after January 1, 2026. No phase-down. On a $30,000 system, roughly $9,000 in customer savings vanished overnight. You can confirm the rule in the IRS guidance on the Residential Clean Energy Credit.
Subsidy gone. Hardware flat. Demand down. One lever left: operations.
So let’s find the leaks.
What are solar soft costs — and why they own half your install
Soft costs are everything that isn’t panels, inverters, racking, or wire. Permitting. Design and engineering. Sales. Interconnection. Overhead.
According to NREL’s PV system cost benchmark, a median US residential system runs $3.25/Wdc — and $1.64/Wdc of that is soft cost. That’s about 50% of the total. On commercial, soft costs add roughly $0.42/Wdc of a $1.55/Wdc system.
Most installers hunt hardware savings when margin tightens. That hunt fails. Your competitor buys from the same distributor at nearly the same price. The real gap sits in the paperwork.
Here’s where the money actually goes.
Leak #1: Customer acquisition (the loud one you can’t fully fix)
CAC is your biggest soft cost, and it’s climbing. Fewer buyers. More bidders. No credit helping you close.
I’ll be straight with you. No plan set vendor and no CRM fixes your ad spend.
But there’s a back door. Every deal that dies between contract and PTO means you paid full acquisition cost for zero revenue — then you pay it again. Shorten your permit-to-PTO window and fewer customers walk. That’s a real CAC win, earned through operations instead of Facebook budget.
Which brings us to the leaks you can close.
Leak #2: Permit rejections — the most expensive line nobody tracks
How much does a solar permit rejection cost?
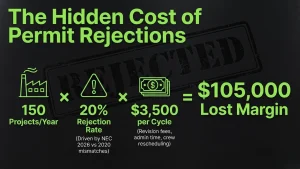
A single solar permit rejection cycle costs $2,000 to $5,000, per Energyscape Renewables — covering revision fees, administrative time, and crew rescheduling. That figure excludes client relationship damage and schedule slippage. Across a full pipeline, rejection cycles are one of the largest controllable solar soft costs an installer carries.
Now run your own number:
Annual projects × rejection rate × $3,500 = your annual permit rework leak.
Run 150 projects a year at a 20% rejection rate? That’s $105,000 gone. Not from bad panels. From a wrong code edition on a title block.
And rejections keep getting easier to earn:
- NEC 2026 enforcement varies by state. California runs it statewide. North Carolina still references NEC 2020. Code-edition mismatch drives an estimated 30–40% of US permit rejections, per Energyscape Renewables.
- NEC 2026 added Section 690.4(G), a rounding rule for voltage and amperage. Teams using last year’s templates are catching corrections on it right now.
- FEOC documentation for battery equipment now lands in permit packages across California, Texas, and Florida.
If you’re a multi-state EPC, the plan set that’s passed a hundred times at home is exactly what gets you rejected two states over. Our solar permit requirements by state guide breaks down the fragmentation jurisdiction by jurisdiction.
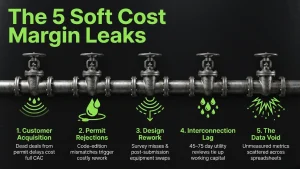
Leak #3: Design rework (the quiet one)
The shading in your proposal doesn’t match the shading in the engineering set. The survey missed rafter spacing. Somebody swapped the inverter after submission.
Each one triggers a redesign. A redesign after submission often triggers a permit amendment — which drops you straight back into Leak #2.
Design rework never appears as its own line item. It hides inside “engineering” and “labor,” and it quietly eats days.
The fix is boring, and it works. Build one design source of truth, checked against the specific AHJ’s code edition before anything gets submitted. Our 2026 solar permit plan set checklist covers every sheet that package needs.
Leak #4: Interconnection lag — the cash-cycle leak
Permits aren’t your only clock. Several utilities across the Southeast and Mid-Atlantic now publish residential interconnection reviews running 45 to 75 business days.
Your crew finished. Customer is calling. Invoice sits uncollectible.
This leak doesn’t cost dollars per project. It costs working capital — and in a tight financing year, that’s what kills companies rather than merely shrinking them.
The fix: file interconnection in parallel with the building permit, never sequentially. Then track every PTO milestone somewhere other than a rep’s inbox.
Leak #5: You can’t fix what you don’t measure
Ask most installers their first-submission approval rate. You’ll get a shrug. Ask their average install-to-PTO window. You’ll get “a few weeks, depends.”
That’s the deepest of all solar soft costs. The data exists. It’s just scattered across spreadsheets, email threads, and three different AHJ portals.
Automation helps — where it exists. SolarAPP+, built by NREL with DOE support, is live in 450+ jurisdictions and has cut review times from as much as 20 business days to effectively zero. NREL estimates an average 14.5-day speedup in participating communities.
But adoption is wildly uneven. Florida has zero SolarAPP+ jurisdictions. A California instant-permit workflow and a Florida manual-submission workflow cannot run out of the same spreadsheet. We compared both paths in our virtual vs. manual permitting workflow guide.
Your 2026 solar soft costs self-audit
Pull these five numbers this week. If you can’t pull them, that is your answer.
- First-submission approval rate, broken out by AHJ
- Average days from permit submission to approval
- Average days from install complete to PTO
- Fully loaded engineering cost per project
- Truck rolls per project
Then run the leak math. Most installers are stunned by the total.
Commercial teams have an extra clock. Projects must begin construction by July 4, 2026 to safe-harbor the 30% 48E credit — which turns engineering turnaround into a revenue-preserving function, not a back-office nicety. See our commercial solar permitting guide for 2026, and rebuild your residential pitch using our state solar incentives closing playbook.
Stop the leak. Then see the leak.
Plug the engineering leak — Energyscape Renewables
We deliver PE-stamped structural and electrical plan sets across all 50 states, already calibrated to the NEC edition your AHJ actually enforces, with FEOC documentation built in from the start. Residential turnaround runs 15–24 hours. Commercial runs 24–48. A 99% first-submission approval rate means you stop eating $2,000–$5,000 rework cycles on out-of-state work — and you convert fixed engineering headcount into variable cost that scales with your pipeline instead of against it.
See the leak — Sunscape
Sunscape is the solar OS built for US installers and EPCs. Permit status, interconnection deadlines, PTO milestones, and site survey data all live in one pipeline, across every jurisdiction you serve. No spreadsheet juggling across three states. No PTO date buried in a rep’s inbox.
One engineering partner. One project management platform.
👉 Book a Sunscape demo — and find out what your solar soft costs are really costing you.
sjayakanth@energyscaperenewables.com