
1 MW Solar Per Year: 2026 State-by-State Output Guide

1 MW Solar Per Year: 2026 State-by-State Output Guide
Wondering how much energy 1 MW solar per year actually delivers? The honest answer is that it depends heavily on the state. In 2026, a 1 MW system produces roughly 1.5 to 2.7 million kWh a year. Because the gap between sunny and cloudy states is so wide, that single number can swing a deal. For installers and EPCs, it now carries your whole proposal.
The short answer: 1 MW solar per year by the numbers
In short, 1 MW of solar per year generates about 1.5 to 2.7 GWh across the United States. A 1 MW array in Arizona can beat the same hardware in Washington State by nearly 80%. So “1 MW” tells you the size of the system, not what it actually makes.

To compare sites fairly, the industry uses two measures. First, specific yield, which is the kWh produced per kW installed each year. Second, capacity factor, which is the actual output versus the theoretical maximum.
Why 1 MW does not produce the same in every state
A nameplate rating shows peak output under perfect lab conditions. Real output, however, drops once weather and equipment enter the picture. As a result, the same panels behave very differently from Phoenix to Seattle.
Three factors drive the spread:
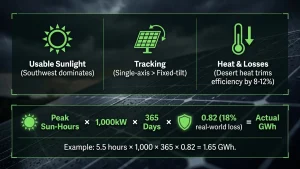
- Sunlight. The Southwest gets far more usable sun-hours than the Northeast or Pacific Northwest. Therefore desert states sit at the top of every yield chart.
- Tracking versus fixed-tilt. Single-axis trackers follow the sun and lift output. That is why ground-mount EPC projects out-produce rooftop arrays of the same size.
- Heat and losses. High desert heat trims panel efficiency by 8 to 12%. Still, the intense sun more than makes up for it, while shading and soiling chip away everywhere.
You can model these factors yourself with the free NREL PVWatts calculator, the U.S. Department of Energy standard.
1 MW solar production by state in 2026
The table below gives fixed-tilt, rooftop-style estimates. Tracking and utility ground-mounts run noticeably higher.
| State | Annual energy per 1 MW | Tier |
|---|---|---|
| Arizona | ~1,800–2,000 MWh | Highest |
| New Mexico | ~1,800–1,950 MWh | Highest |
| Nevada | ~1,750–1,900 MWh | Highest |
| California | ~1,600–1,800 MWh | High |
| Colorado | ~1,550–1,750 MWh | High |
| Texas | ~1,500–1,750 MWh | High |
| Florida | ~1,450–1,650 MWh | Mid |
| North Carolina | ~1,400–1,550 MWh | Mid |
| Massachusetts | ~1,150–1,350 MWh | Lower |
| New York | ~1,150–1,300 MWh | Lower |
| Michigan | ~1,100–1,300 MWh | Lower |
| Washington | ~1,050–1,200 MWh | Lower |
These figures model out from PVWatts v8. So treat them as a planning baseline, then run a site-specific model before you quote. For deeper national data, the EIA electricity hub tracks solar generation by state.

A quick field check for 1 MW solar per year
You do not need software to gut-check a figure on site. First, take the daily peak sun-hours for the location. Next, multiply by 1,000 kW, then by 365. Finally, knock off about 18% for real-world losses.
For example, a site with 5.5 peak sun-hours runs 5.5 × 1,000 × 365 × 0.82, or roughly 1.65 GWh a year per MW. Of course, this is a napkin check, not a stamped design. However, it catches the wildly wrong proposals before they reach a customer. When your quick math and your software disagree by a lot, that is your cue to recheck shading, tilt, or module specs.
Why this matters more in 2026
The economics changed on January 1. The 30% federal residential solar tax credit (Section 25D) expired on December 31, 2025 under the One Big Beautiful Bill Act. As a result, there is no residential credit in 2026.
For commercial and utility work, the ITC (Sections 48 and 48E) is still available. However, projects must begin construction by July 4, 2026 to lock in the full credit. So the clock is now part of every commercial bid.
This shift hits installers in two clear ways:
- Residential sales rest on production math. Without a 30% credit to soften the price, the payback story leans entirely on accurate kWh projections. Overpromise, and you return to the roof to explain a shortfall. Underpromise, and a sharper competitor takes the job.
- Commercial EPCs are racing the clock. Hitting the July deadline means engineering and permitting have to move fast. Therefore, there is no room for redesigns caused by loose yield assumptions.
What accurate yield means for your bids
An estimate that is off by even 10% moves the payback, the financing, and the signature. State-level yield is your starting point. The real number, though, comes from site-specific modeling. Roof pitch, azimuth, shading, module choice, and inverter clipping all push it up or down.
Here is where installers usually get burned:
- They quote from a national rule of thumb instead of state and site data, then eat the callbacks.
- Their sales proposal and engineering design use different assumptions.
- Slow turnaround pushes a commercial project past the ITC deadline.
The fix is one source of truth. That means solid engineering up front, plus one platform where the number in the proposal matches the number that gets designed, permitted, and built. To see how that pipeline works, browse the Energyscape Renewables services or the Sunscape platform plans.
Ready to quote and build faster?
In 2026, production math carries the sale and the ITC clock keeps ticking. So accuracy and speed win the work. Energyscape Renewables gives installers and EPCs fast, PE-stamped plan sets and permit-ready engineering across all 50 states. That way, the yield you promise is the yield you design and build.
Sunscape, the solar OS, then keeps that number consistent from the first site survey through proposal, permitting, and PTO. As a result, nothing slips between your sales floor and your install crew.
See how fast your pipeline can move. Book a Sunscape demo today, and Energyscape will handle the engineering while you close more deals.
Frequently asked questions
How much energy does 1 MW of solar produce per day?
Roughly 4,000 to 7,400 kWh per day, depending on the state and season. Sunny Southwest sites sit at the top of that range.
How many homes can 1 MW of solar power?
About 150 to 250 average U.S. homes. This assumes yearly output against typical household use near 10,000 kWh.
What is a good capacity factor for solar?
Fixed-tilt sites usually run 17 to 22%. Single-axis tracking in strong-sun states can push past 28%.
Does 1 MW of solar produce the same in summer and winter?
No. Summer output often runs 140 to 160% of the winter baseline.
sjayakanth@energyscaperenewables.com